Pubblicato il: 2023-12-05
This report was coordinated and written by the University of Bari Aldo Moro and Politecnico di Milano research groups.
Proprietari
Contributori
To support the design of the dashboard, we first performed an extensive literature review on the topic of resilience, which has been developed across heterogeneous and multidisciplinary academic domains. More specifically, we decided to study the level of resilience and attractiveness of territories through the concept of territorial capacities, referring to those characteristics of a territory that can explain its ability to respond to a
shock. In particular, territorial capacities refer to the set of material and immaterial assets accumulated over time that can be leveraged by territories to generate value; as such they can provide a comprehensive overview of the factors that may contribute to the sustainable development of territories.
Then, moving from the concept of territorial capital, we identified the key dimensions of analysis, including economic, human, physical and social capital. Based on these four categories, we identified a comprehensive set of indicators aimed at measuring the key
aspects of the resilience and attractiveness of territories. The data for computing the selected indicators were collected from public sources, including the National Statistical Office (ISTAT), the Ministry of Economic and Finance (MEF), the Italian Institute for Environmental Protection and Research (ISPRA), the Authority for Communications Guarantees (AGCOM) and other public institutions with relevant data repositories.
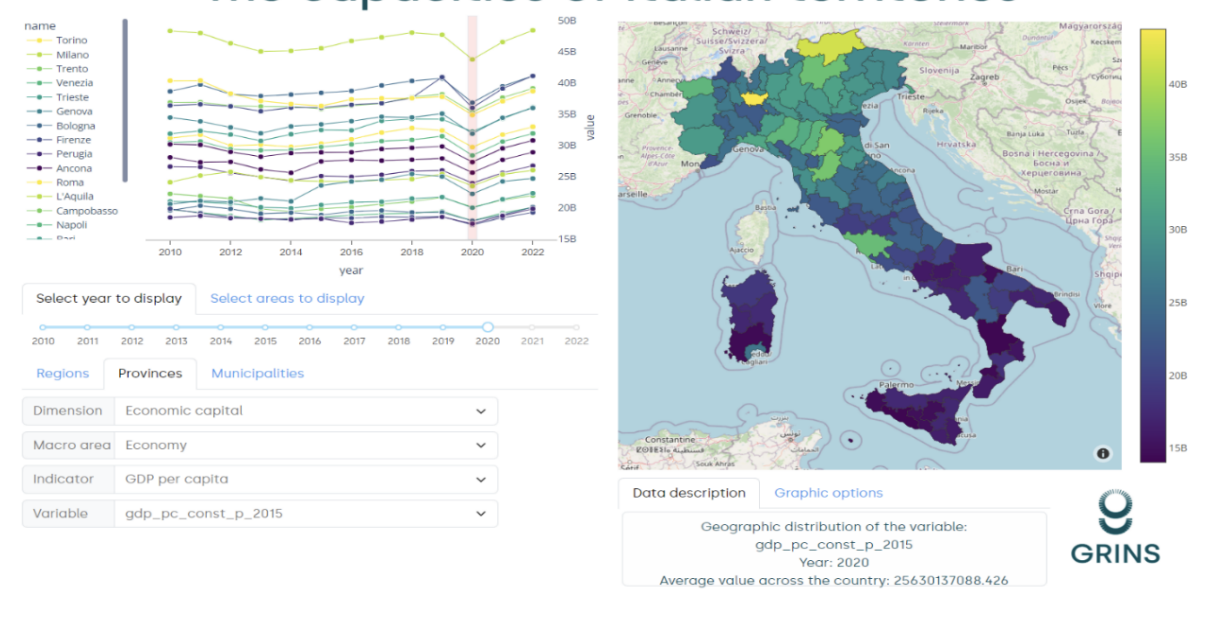
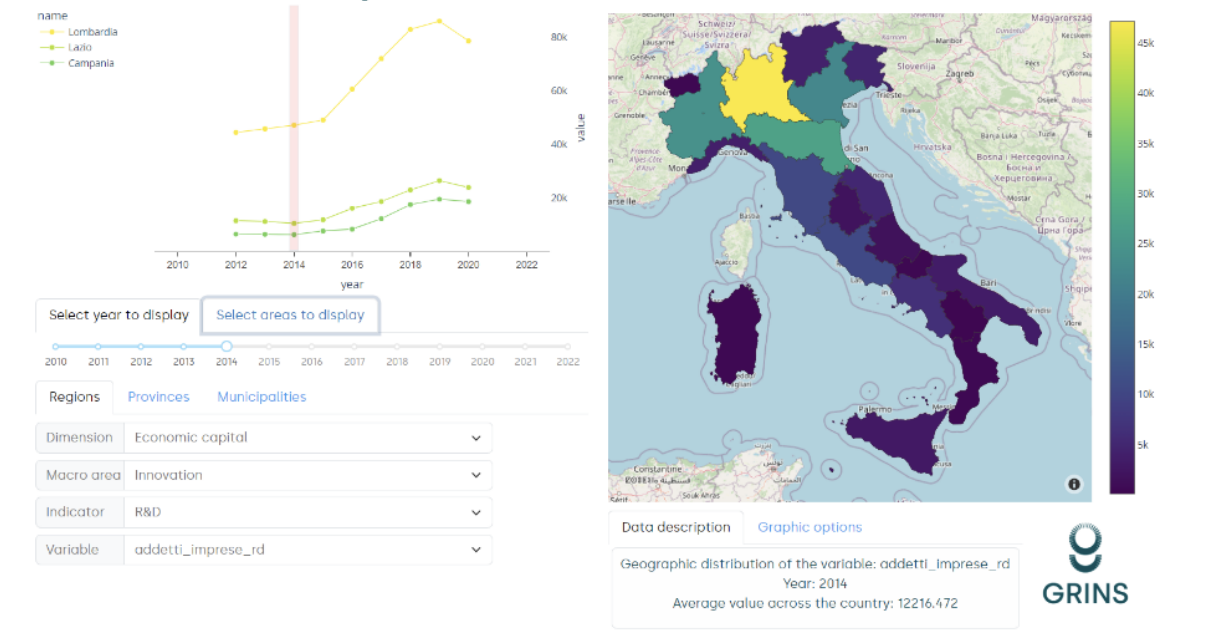
The final step consisted of the preliminary development of a digital dashboard to support the visualization of the indicators referred to different territories. The dashboard allows us to navigate the indicators at different granularity levels, highlighting temporal and spatial variability, comparing different territories, and evaluating gaps both between an within territories. Not all the indicators are available for all the granularity levels and time-
frames, hence we verified and reported their availability across time and space. In general, the selected indicators tend to have good coverage at all geographical scales (e.g., regions, provinces, municipalities). Nonetheless, they tend to be available for shorter periods when focusing on a higher level of spatial resolution.
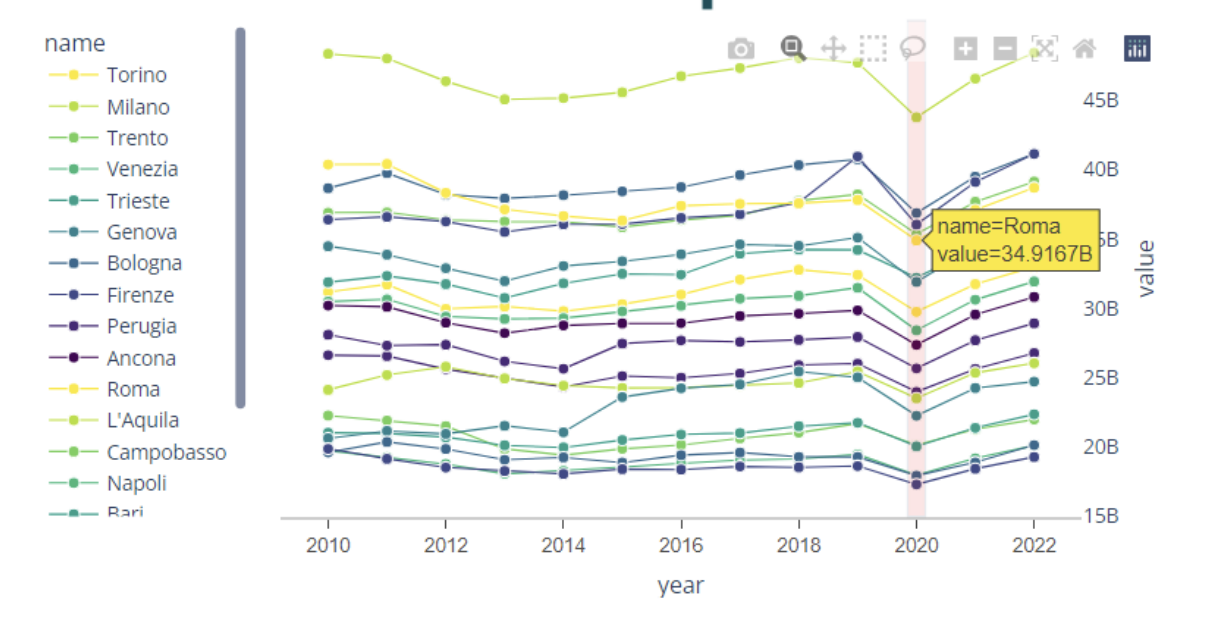
Some figures on the dashboard follow. Download the full report to see them all:
Fondazione GRINS
Growing Resilient,
Inclusive and Sustainable
Galleria Ugo Bassi 1, 40121, Bologna, IT
C.F/P.IVA 91451720378
Finanziato dall'Unione europea – NextGenerationEU nell'ambito del Piano Nazionale di Ripresa e Resilienza (PNRR), Missione 4 (Istruzione e ricerca), Componente 2 (Dalla ricerca all'impresa), Investimento 1.3 (Partenariati estesi), Tematica 9 (Sostenibilità economico-finanziaria dei sistemi e dei territori).